
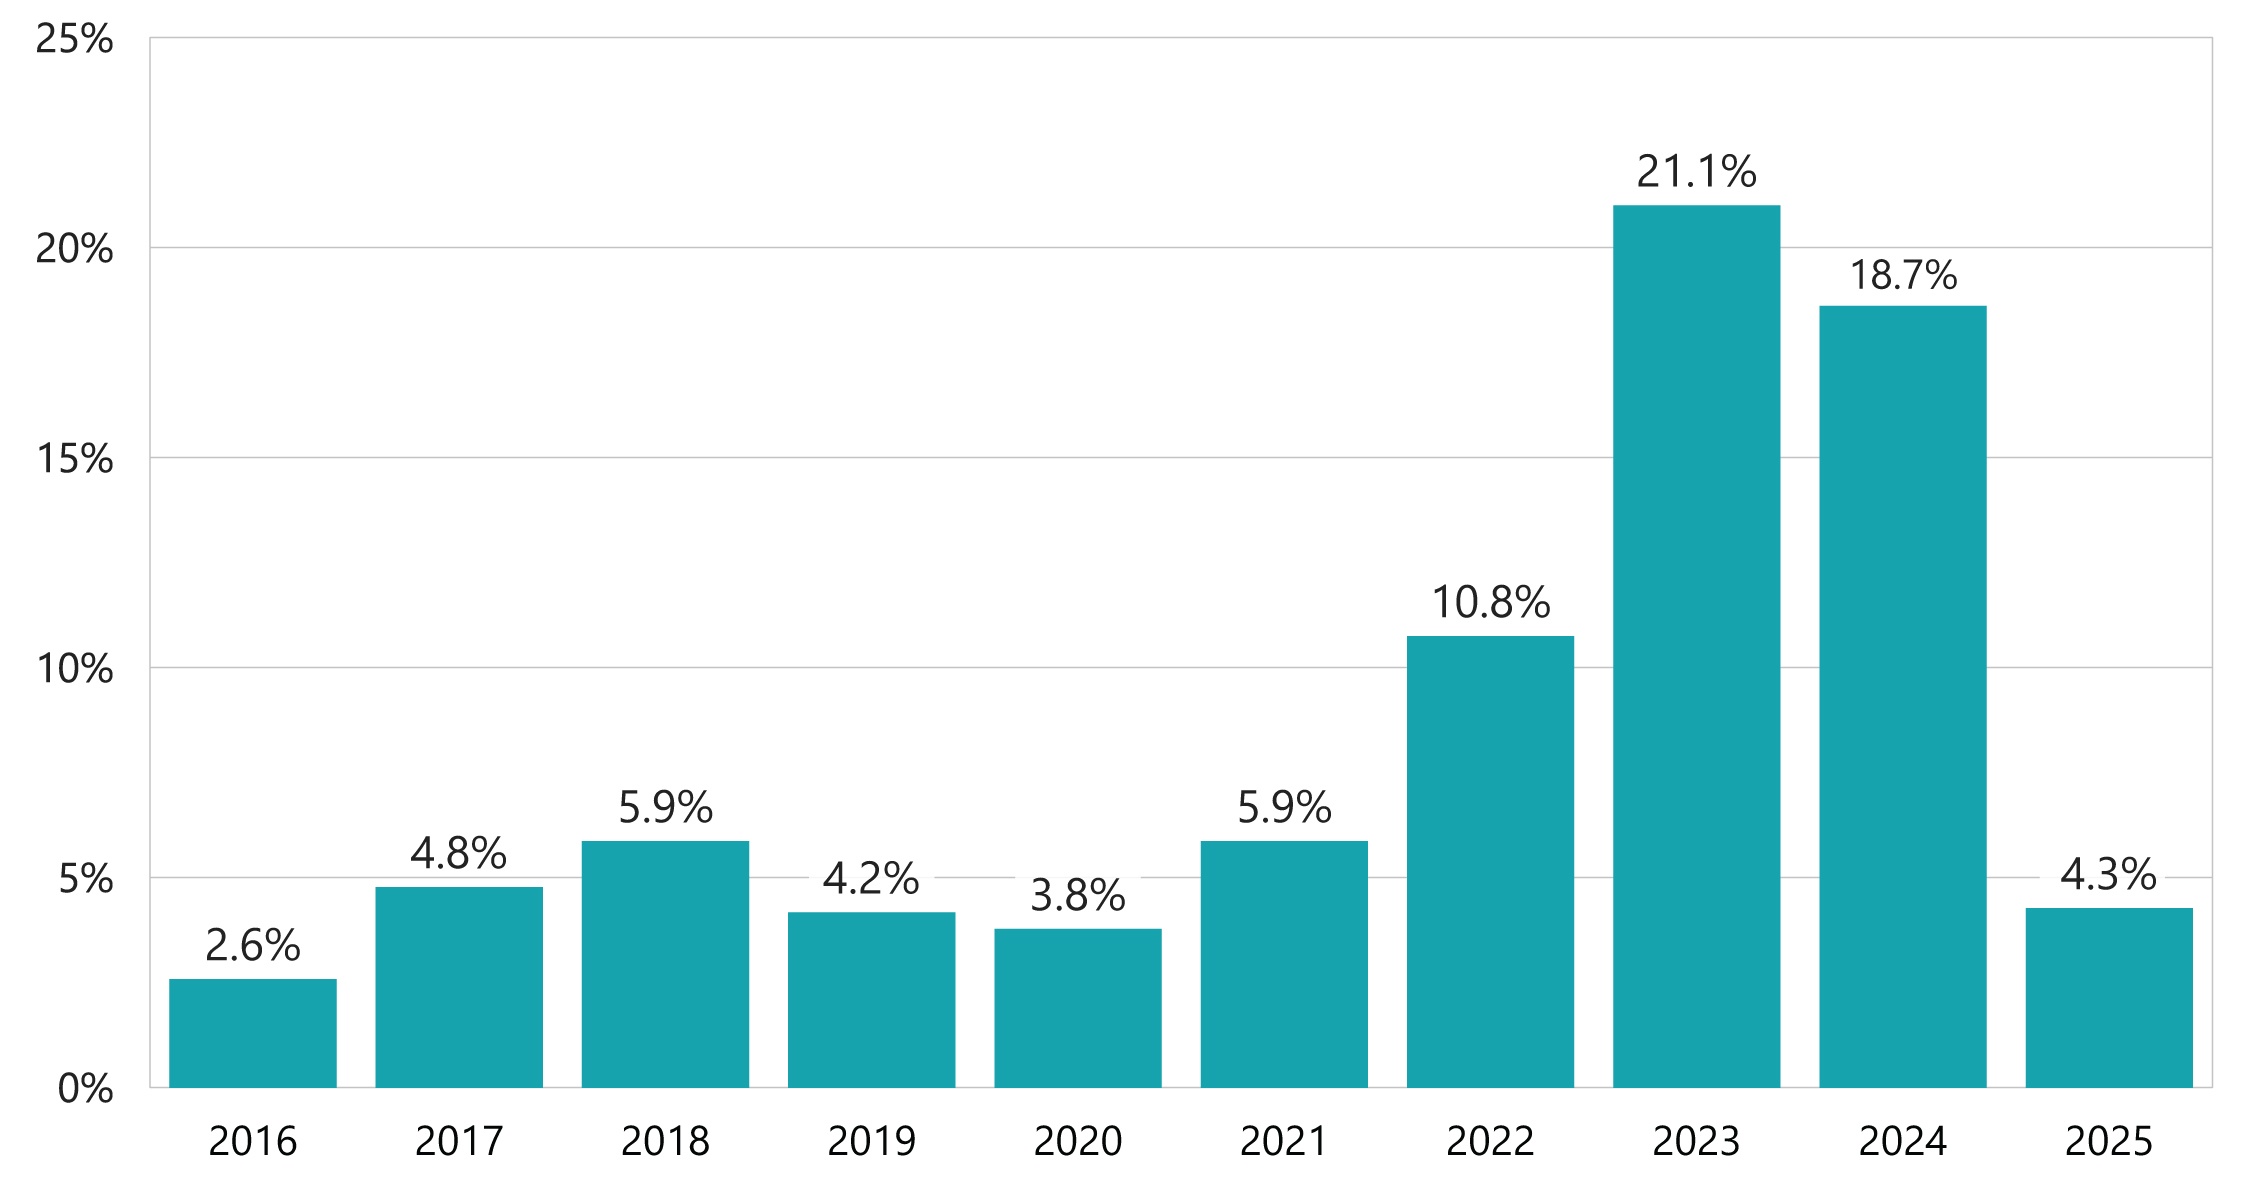
Your premiums for auto and home insurance are likely different every year. This shows how much insurance companies have changed their rates on average across the state.
Private passenger auto average rate change

Source: TDI rate filing data
Homeowners average rate change
Source: TDI rate filing data
Note: includes rate changes for owner-occupied homeowners, tenants, condos, and mobile homeowners policies.
What’s the difference between a premium and a rate?
Premium – The amount you pay to an insurance company for an insurance policy.
Rate – The cost of insurance per exposure unit ($1,000 of home coverage or one year of auto coverage).
Example – A gallon of gas costs $3.50. I pay $49 to fill up my car’s 14-gallon gas tank. The premium is $49. It’s the rate ($3.50) times the unit (14 gallons).
Learn more
How are your auto and homeowners insurance costs calculated?

Tips and help
Help and complaints: Get help with questions and issues with your insurance company or agent.
Insurance tips: Learn how to save on insurance, get the coverages you need, and protect yourself from fraud.
Videos: Get informed on a range of insurance topics.
Podcasts: Hear tips and get answers about insurance.