
Key findings
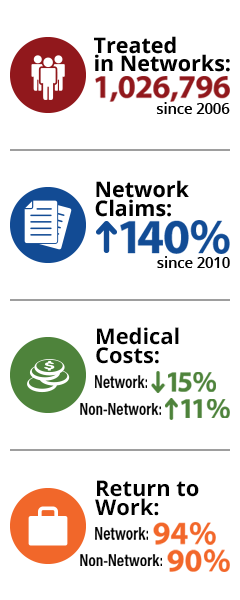
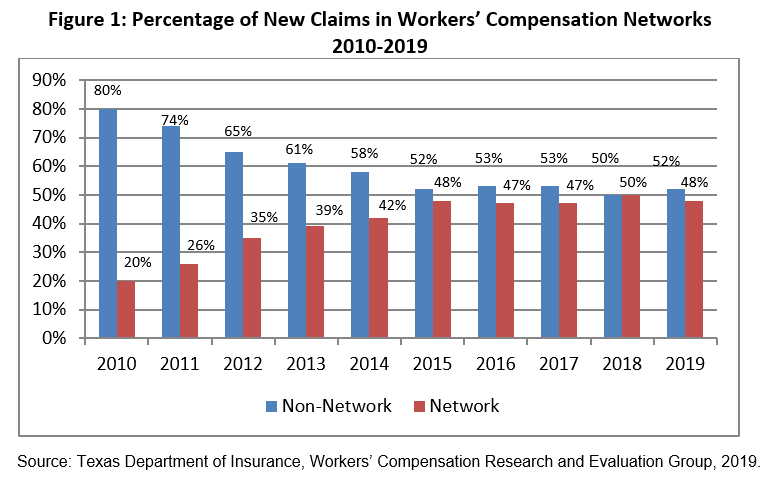
48 percent of all new workers’ compensation claims in 2019 have been treated in networks, up from 20 percent in 2010.
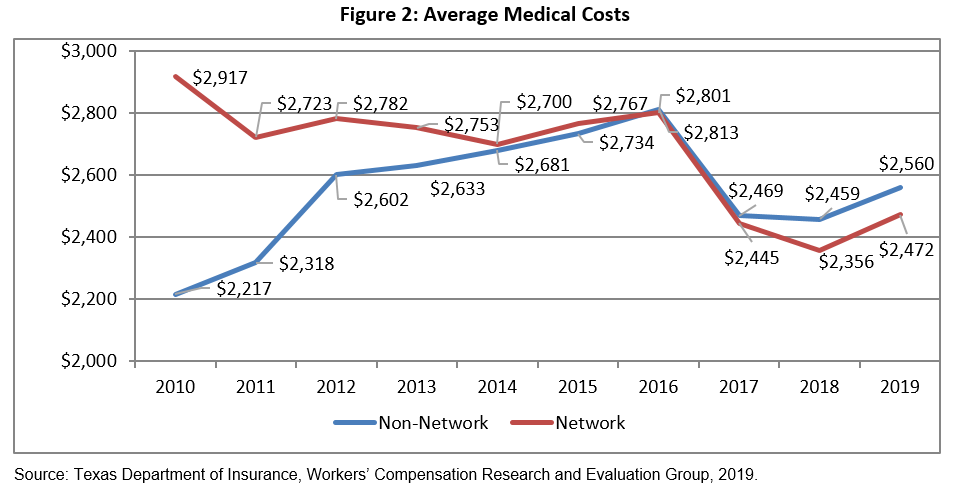
Overall, medical costs in networks still outperform those in non-network and are down 15 percent since 2010. Over the same time, non-network average medical costs increased by 11 percent.
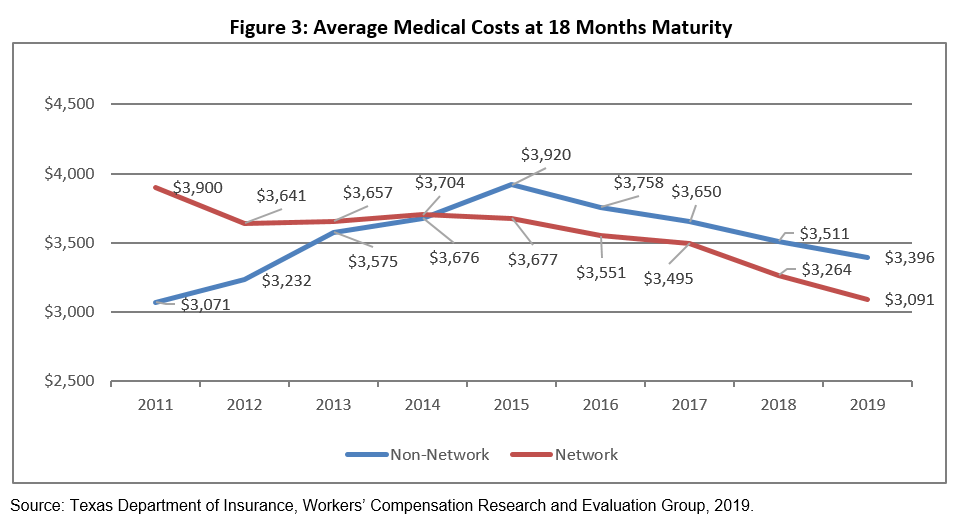
The overall average medical cost for network injured employees at 18 months was lower than non-network injured employees prior to the 2015 report card. This supports measures which show networks provide higher utilization of services than non-network in the first six months of injury, but less during the following 12 months.
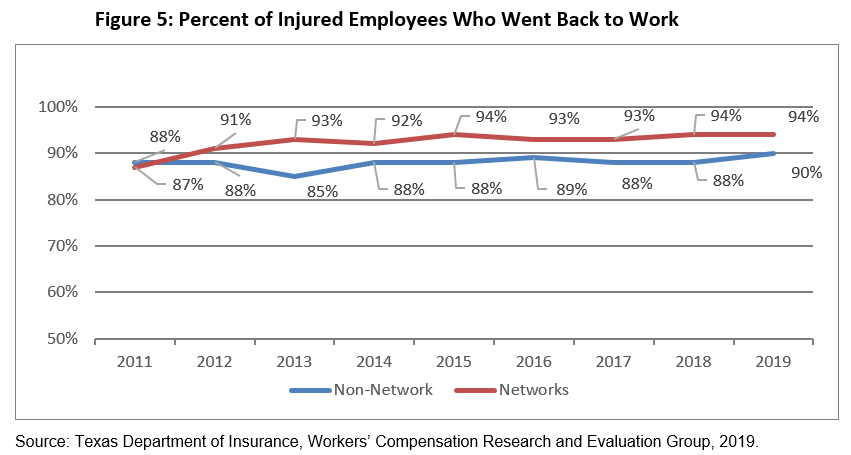
The percentage of network injured employees who went back to work after their injury increased to 94 percent in 2019, an increase of seven percentage points since 2011. The return-to-work rate for non-network injured employees has remained relatively steady at 90 percent for the same timeframe.
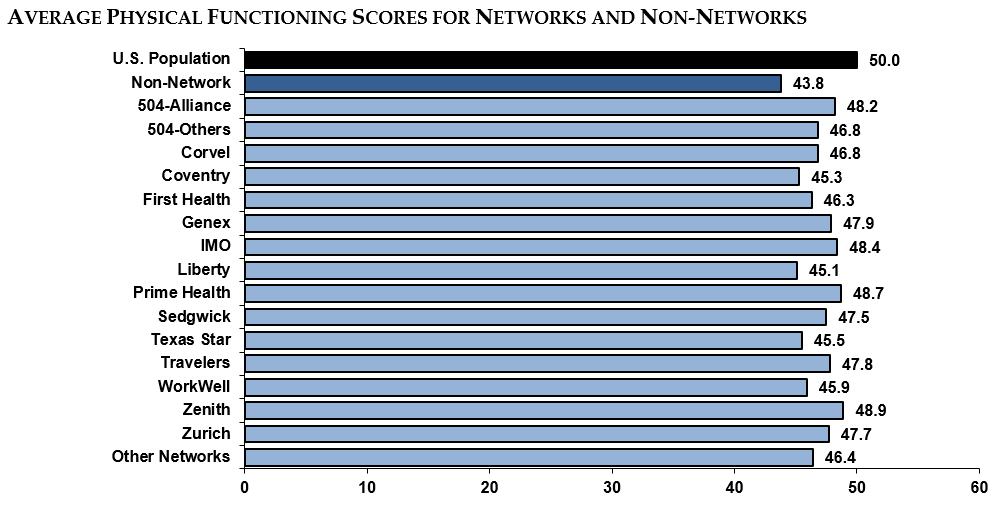
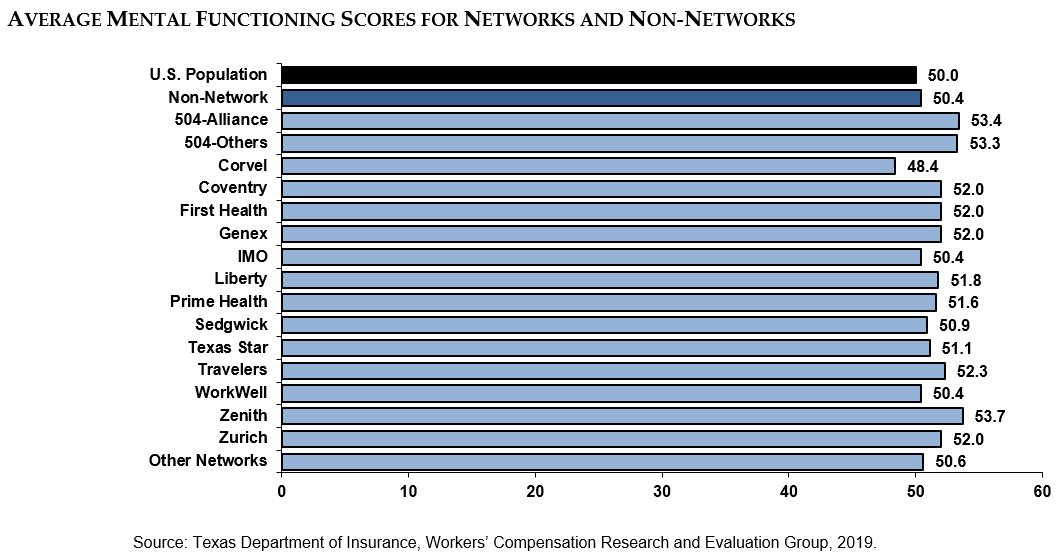
Physical functioning measures a person’s ability to do everyday tasks. Mental functioning measures a person’s ability to think and reason. All networks had higher physical functioning scores among their injured employees than non-network. Most network patients had better or equal mental functioning scores as well. Both of these scores among network injured employees have consistently been higher than those of non-network injured employees and the U.S. population since 2012.
Measures presented in this report card were created using data gathered from a variety of sources:
- Medical cost, utilization of care, and administrative access to care measures were calculated using the DWC medical billing and payment database, a collection of about 100 medical data elements, including charges, payments, and Current Procedural Terminology (CPT) and diagnosis codes for each injured employee.
- Access to care, satisfaction with care, return-to-work, and health outcomes measures were calculated using the results of an injured employee survey conducted by the Public Policy Research Institute at Texas A&M University on behalf of REG.