Skip to Top Main Navigation Skip to Content Area Skip to Footer
Texas Department of Insurance
Topics:   A B C D E F G H I J K L M N O P Q R S T U V W X Y Z All

Snapshot: Utilization and Cost of Hospital/Institutional Services, 2016-2020

Workers’ Compensation Research and Evaluation Group

This report presents fundamental metrics on the cost and utilization of hospital/institutional services in the Texas workers’ compensation system. The data used in this report comes from hospital/institutional billing and payment data that insurance carriers report to the Division of Workers’ Compensation (DWC).

Read the full report.

Published: June 2022 by the Workers' Compensation Research & Evaluation Group.

Snapshot: Utilization and Cost of Hospital/Institutional Services, 2016-2020
From 2016 to 2020 about one third of claims receiving health care benefits had one or more hospital/institutional services. The number of claims that received hospital/institutional services was stable from 2016 to 2019 but significantly declined in 2020. In each injury year, over 95 percent of claims that received hospital/institutional services had one or more hospital outpatient services. Only five percent of claims had hospital inpatient services and four percent of claims had other services.
Figure 1.1: Number and share of hospital/institutional claims in medical combined, 2016-2020

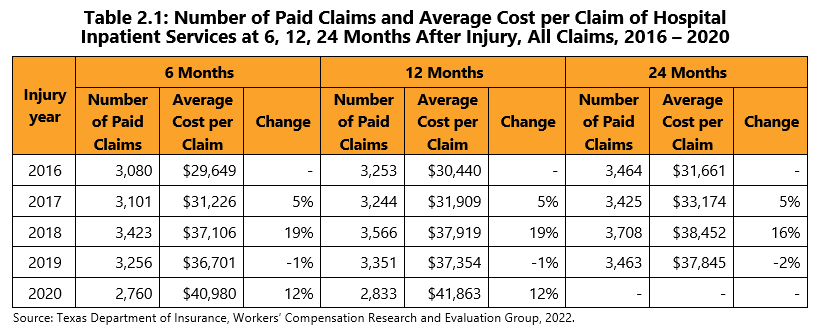
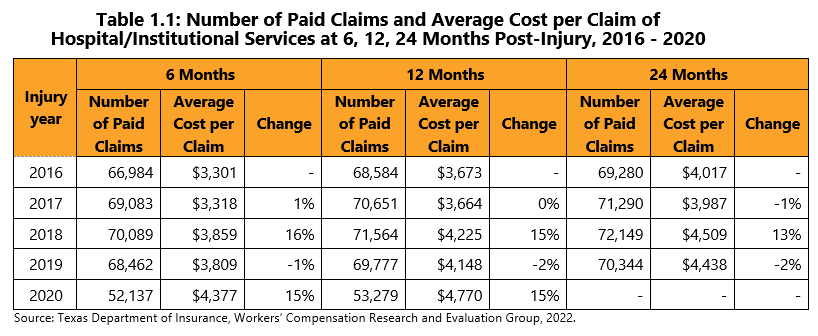
Overall, the average hospital/institutional cost per claim increased from 2016 to 2020 with large increases in 2018 and 2020. The average hospital/institutional cost per claim at six months post-injury increased 16 percent from 2017 to 2018 and 15 percent from 2019 to 2020. The average cost per claim at 12 months post-injury increased 15 percent from 2017 to 2018 and 15 percent from 2019 to 2020. The average cost per claim at 24 months post-injury increased 13 percent from 2017 to 2018.

Table 1.1: Number of Paid Claims and Average Cost per Claim of Hospital/Institutional Services at 6, 12, 24 Months Post-Injury, 2016 - 2020

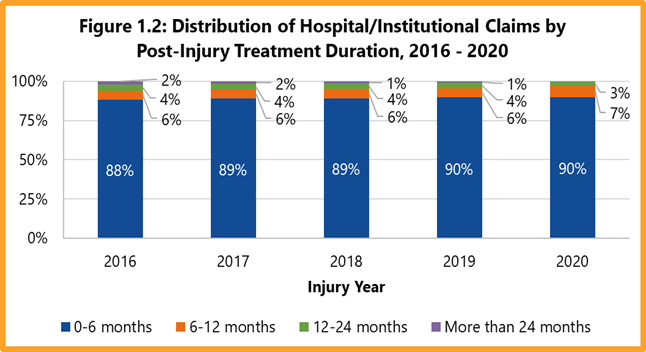
Nearly 90 percent of claims receiving hospital/institutional services received those services for less than six months after injury. Around 10 percent received the services for more than six months.

Figure 1.2: Distribution of hospital/institutional claims by post-injury treatment duration, 2016-2020

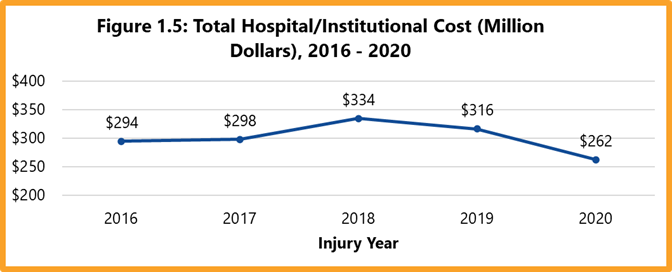
The overall cost of hospital/institutional services increased from $294 million dollars in 2016 to $334 million dollars in 2018 and then deceased to $262 million dollars in 2020. The increase was mainly from 2017 to 2018 and the decline was the greatest from 2019 to 2020. Specifically, the total cost increased by 12 percent from 2017 to 2018 and decreased by 17 percent from 2019 to 2020.

Figure 1.5: Total hospital/institutional cost (million dollars), 2016-2020
The average hospital inpatient cost per claim increased by 38 percent from 2016 to 2020 with large increases in 2018 and 2020. The average cost per claim at six months post-injury increased 19 percent from 2017 to 2018 and 12 percent from 2019 to 2020. The average cost per claim at 12 months post-injury also increased 19 percent from 2017 to 2018 and 12 percent from 2019 to 2020. The average cost per claim at 24 months post-injury increased 16 percent from 2017 to 2018.
Table 2.1: Number of Paid Claims and Average Cost per Claim of Hospital Inpatient Services at 6, 12, 24 Months After Injury, All Claims, 2016 – 2020

For more information, contact: WCResearch@tdi.texas.gov

Last updated: 6/23/2022