This report presents system trends that allow the Division of Workers’ Compensation, policymakers, and system stakeholders to gauge the relative health of the Texas workers’ compensation system and consider whether additional legislative changes are necessary.
Published: December 2020 by the Division of Workers' Compensation.
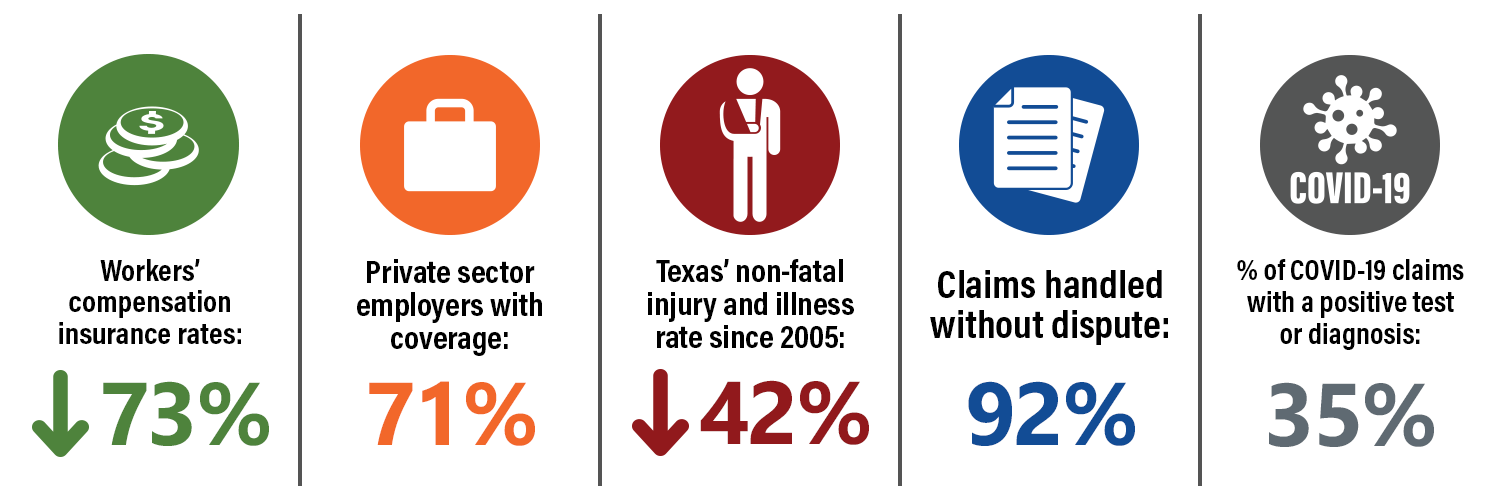
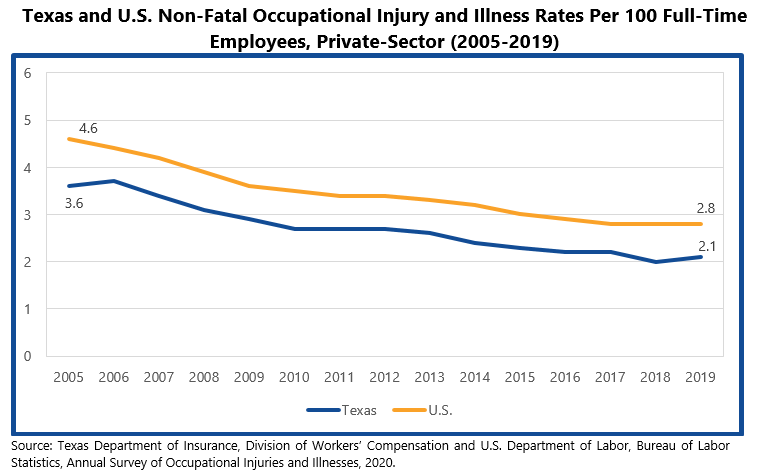
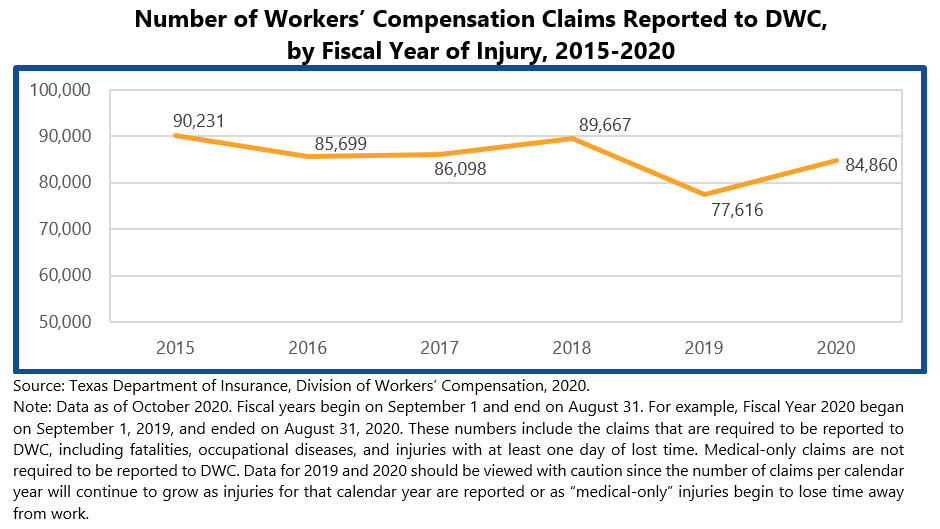
The non-fatal injury and occupational illness rate is down 42 percent from 2005, but COVID-19 resulted in a 9 percent increase in the total number of claims filed since 2019.
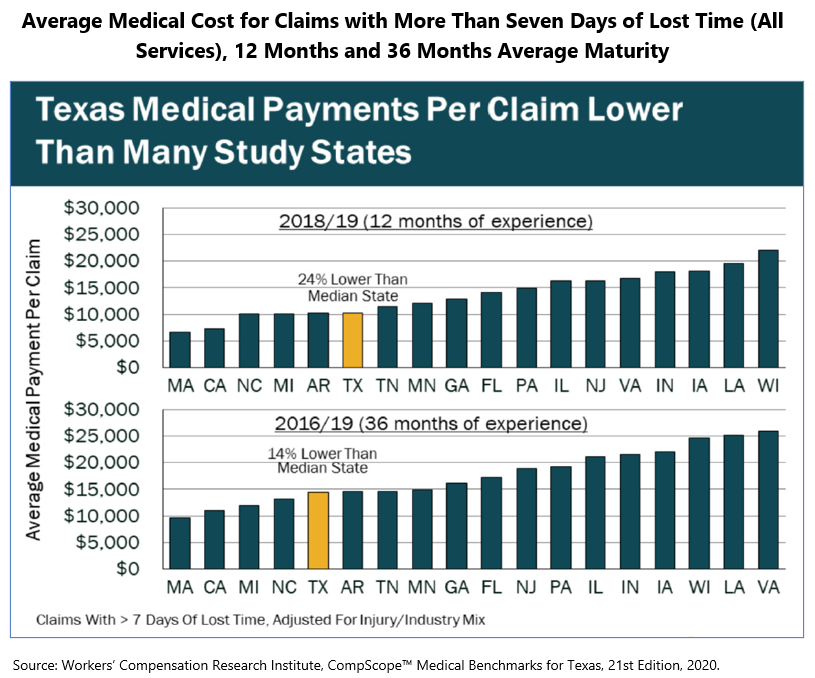
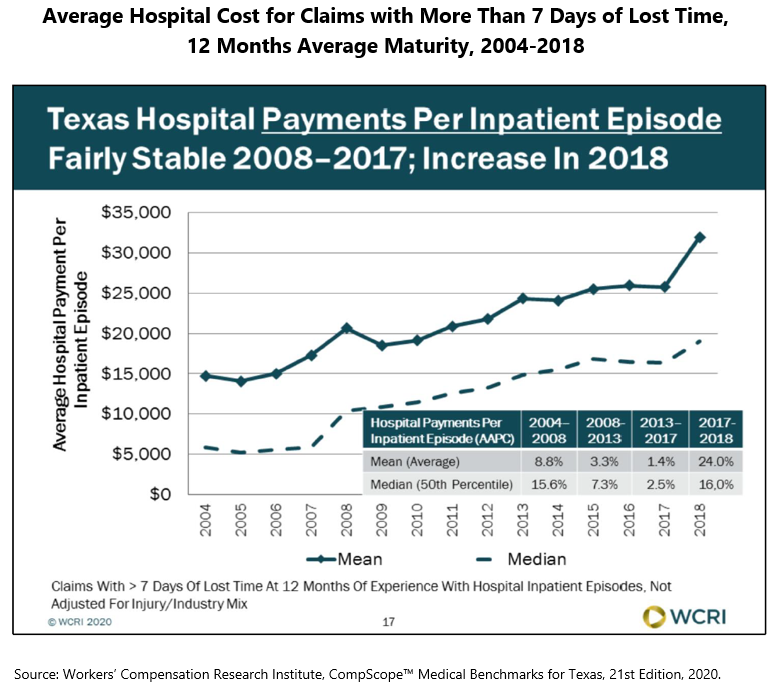
Texas’ cost per claim with 12 months maturity is about 24 percent less than the median cost of the 18 states analyzed. But in 2018, in-patient hospital costs rose by about 24 percent.
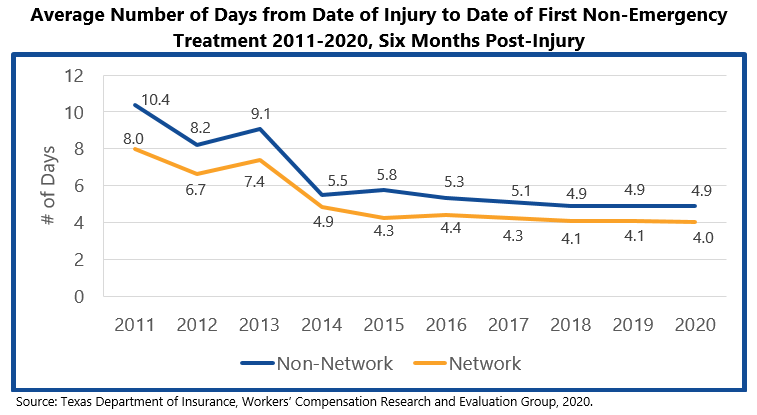
Today on average, injured employees are waiting half as long to get their first non-emergency medical visit as they did in 2011.
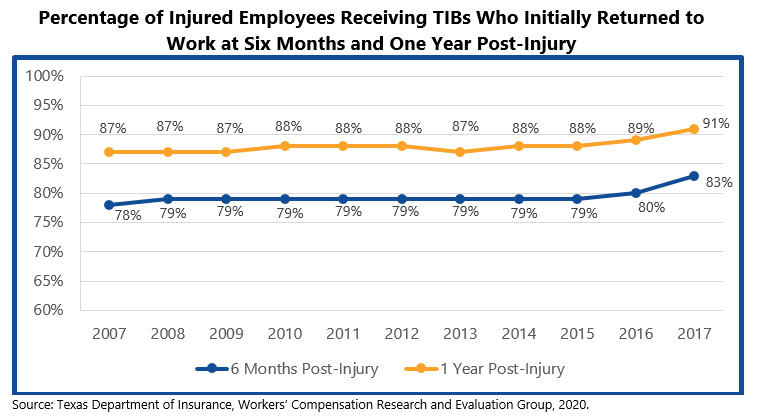
More injured employees receiving income benefits are getting back to work within six months - 83 percent compared to 74 percent in 2004. About 9 out of 10 injured employees receiving temporary income benefits (TIBs) return to work within one year of their injury.
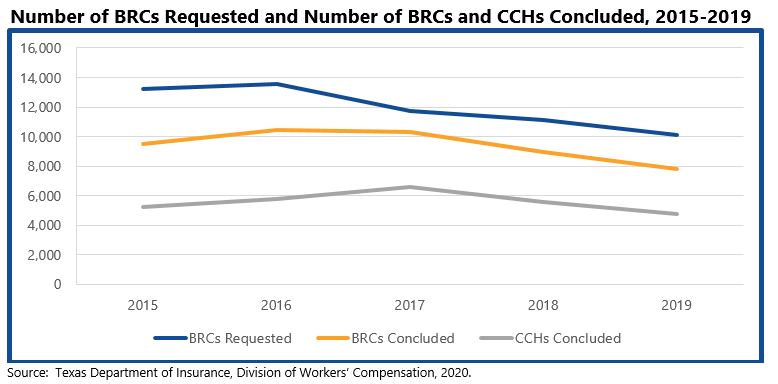
About 92 percent of claims are handled without the need for dispute resolution with DWC. Since 2015, the number of benefit review conferences (BRCs) concluded declined 18 percent, while the number of contested case hearings (CCHs) declined 9 percent.
Medical necessity disputes continue to decline each year. While networks accounted for about half of all new claims in the last few years, non-network claims accounted for most of the medical necessity disputes filed (about 8 out of 10 disputes filed).

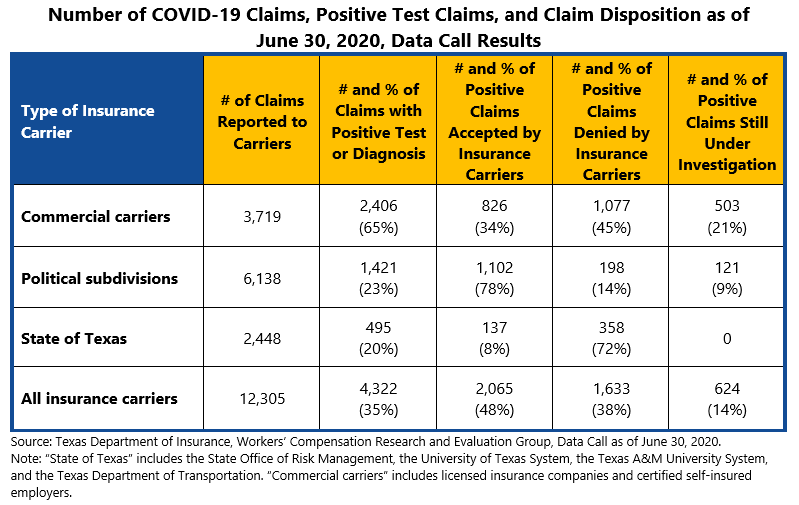
Initial data call results show that only about 35% of COVID-19 claims filed resulted in a positive test or diagnosis. Among these positive test claims, nearly half (48 percent) were accepted as work-related by insurance carriers, more than a third (38 percent) were denied by the insurance carriers, and 14 percent were still under investigation. Despite the number of COVID-19 claims that were denied, DWC’s administrative data (as of October 25, 2020), showed that there were only 10 COVID-19 claim disputes filed with DWC.