About the report
The claims in this report represent the claims that actually received pharmacy services. This report analyzes pharmacy utilization and cost in the Texas workers’ compensation system between 2009 and 2022 to capture data before and after the introduction of the formulary, including:
- Number of pharmacy claims and prescriptions.
- Prescription costs.
- Most frequently prescribed drugs before and after the formulary.
- Access to pharmacy services.
Published September 2023 by the Workers' Compensation Research & Evaluation Group.
Summary
The Texas Division of Workers’ Compensation (DWC) adopted a pharmacy closed formulary for injured employees in the Texas workers’ compensation system in 2011. The formulary applies to both network and non-network claims and intends to apply evidence-based medicine guidelines to ensure quality medical treatment for injured employees while controlling costs and unnecessary utilization. The formulary includes all FDA‐approved drugs but excludes drugs with an “N” status (or not recommended) in Appendix A of DWC’s adopted treatment guidelines, experimental and investigational drugs, and drugs created by compounding. Drugs excluded from the closed formulary require preauthorization. This report analyzes pharmacy costs and utilization in the Texas workers’ compensation system using data before and after the formulary (2009-2022).
Key findings
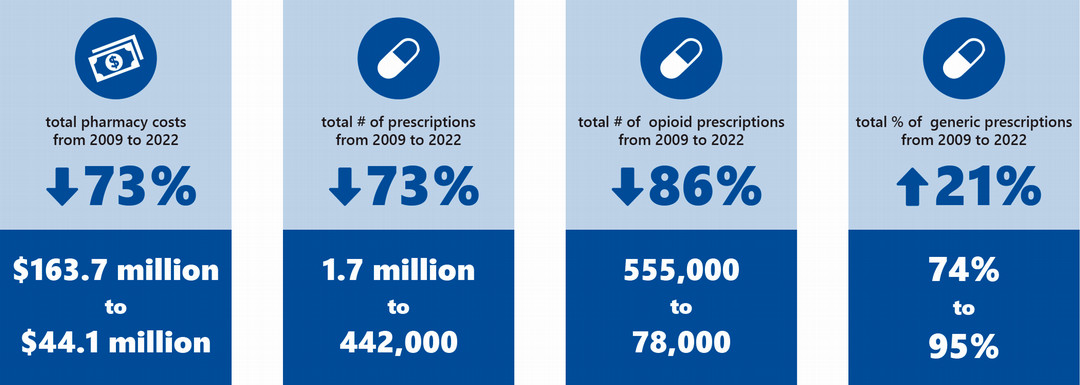
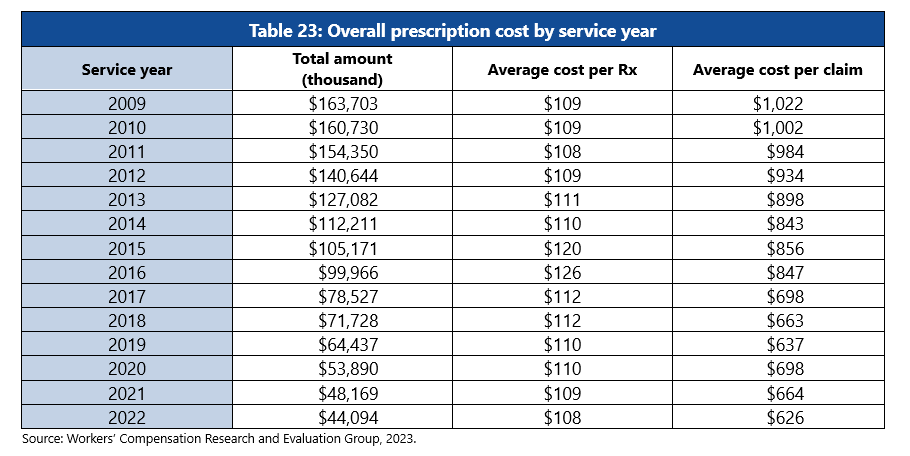
Overall pharmacy service costs decreased from 2009 to 2022. The total pharmacy cost declined 73% (from about $163.7 million in 2009 to $44.1 million in 2022), and the average cost per claim declined 39% for claims in service year 2009 to 2022 (from $1,022 to $626). More cost reduction was observed in lost-time claims than in medical-only claims.
Overall opioid prescription costs decreased from 2009 to 2022. Opioid N status drug costs decreased 97% (from about $18.1 million in service year 2009 to about $603,000 in 2022), opioid non-N status drug costs declined 88% (from about $30.8 million to $3.6 million).
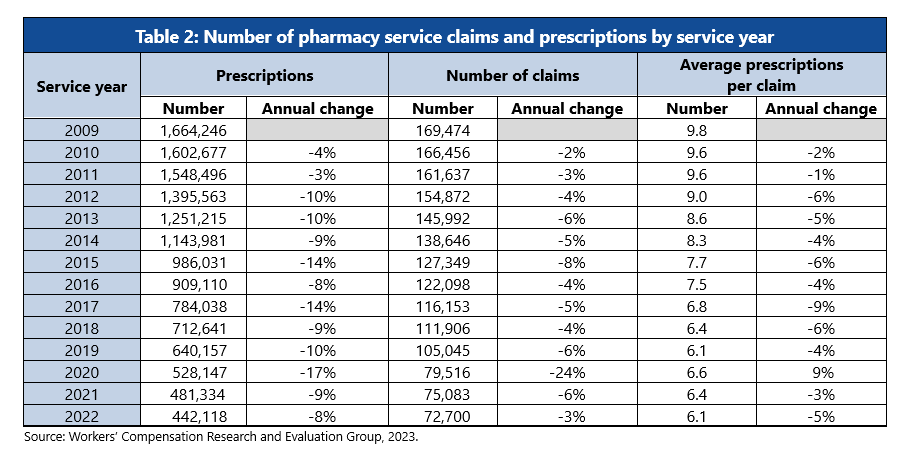
Overall pharmacy service utilization decreased from 2009 to 2022. The total number of pharmacy claims decreased 57% (from about 170,000 in 2009 to 73,000 in 2022), total number of prescriptions decreased 73% (from about 1.7 million to 442,000), and average number of prescriptions per claim decreased 38% from service year 2009 to 2022 (from about 10 to 6).
Overall number of opioid prescriptions decreased from 2009 to 2022. The number of opioid prescriptions decreased 86% from service year 2009 to 2022 (from about 555,000 to 78,000) and opioid N status drug prescriptions decreased 96% (from about 48,000 to 2,000).
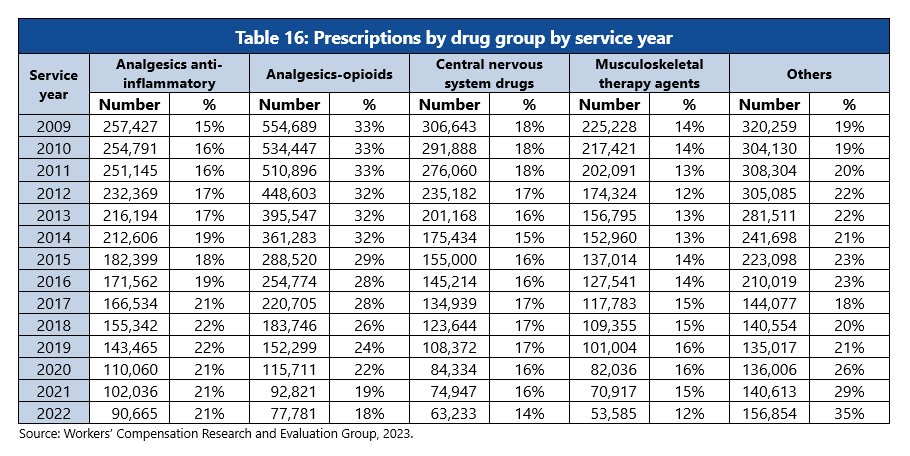
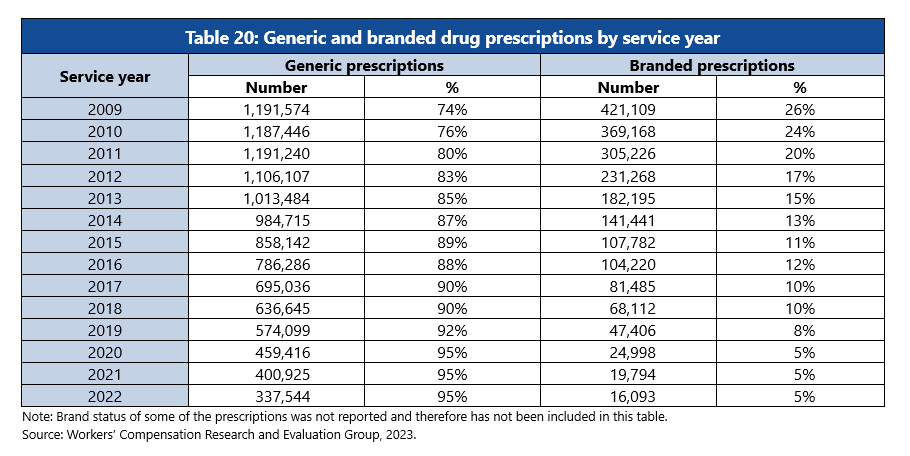
Use of generic prescriptions instead of branded drugs increased from 2009 to 2022. Despite the utilization of prescriptions decreasing, the percentage of generic prescriptions used instead of branded drugs increased from service years 2009 to 2022 (from 74% to 95%).